If in Study/Country Parameters for monitoring level at least 'Centers' (even if not 'Patients') is ticked, i.e., Centers are tracked individually in the system via Selected Centers, you will get the window Study/Country Automatic Summaries.
The CROs line is the total of all summaries) from EXTERNALIZED SERVICES option.
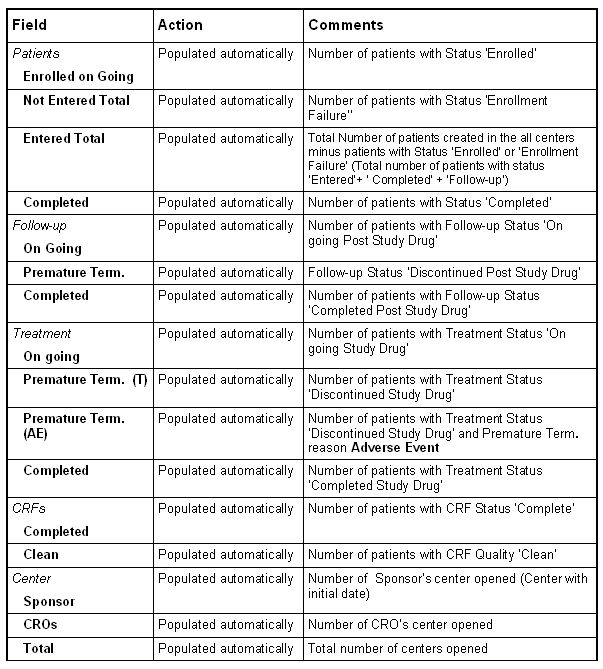
The fields in the white row are populated automatically
depending on the data of the Center summary respectively
Patient List or Center Manual Summary.
The fields in CROs grey are also populated automatically depending on the data of the Summaries via EXTERNALIZED SERVICES option.
If the figures displayed in Study/Country Automatic Summary are not correct, go to the summary of the Center respectively Patient List and Center Manual Summary and make the necessary changes.